MicroStrategy shares jumped more than 10% on Monday, adding to recent gains following the stock’s recent correction.
The software firm purchased an additional 6,911 bitcoins between March 17 and March 23, takings its holding to over 500,000 BTC, according to a regulatory filing.
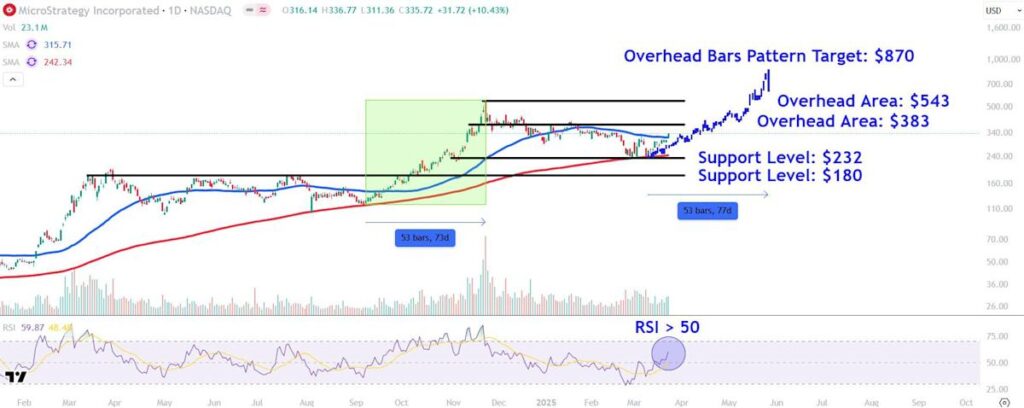
After initially finding buying interest at the 200-day moving average in recent weeks, the price closed above the 50-day MA on Monday, potentially setting the stage for a continuation of the stock’s longer-term trend higher.
Investors should watch major overhead areas on MicroStrategy’s chart around $383, $543, and $870, while also monitoring key support levels near $232 and $180.
MicroStrategy (MSTR) shares jumped more than 10% on Monday, adding to recent gains following the stock’s recent correction.
Shares in the company, which is the world’s largest corporate holder of bitcoin, received a boost after a regulatory filing on Monday revealed that the software firm had purchased an additional 6,911 bitcoins between March 17 and March 23, takings its holding to over 500,000 BTC. MicroStrategy’s accumulation of the digital currency, which began in 2020, has shown no signs of slowing.
Shares of MicroStrategy, which does business under the name Strategy, have gained 16% since the start of the year as of Monday’s close and have more than doubled over the past 12 months as investors turn to the stock as a leveraged Bitcoin bet. The stock rose 10.4% to $335.72 on Monday as the price of bitcoin moved higher.
Below, we break down the technicals on MicroStrategy’s chart and point out major price levels worth watching out for.
After retracing to the closely watched 200-day moving average, MicroStrategy shares traded sideways for several weeks before finding renewed buying interest.
More recently, the stock closed above the 50-day MA on Monday, potentially setting the stage for a continuation of the stock’s longer-term uptrend.
Meanwhile, the relative strength index (RSI) flashes a reading above 50 to signal bullish price momentum, but also sits below overbought levels, providing the stock with ample room to test higher prices.
Let’s apply technical analysis to identify major overhead areas on MicroStrategy’s chart that investors may be monitoring and also point out support levels worth watching during possible pullbacks in the stock.
The first overhead area to eye sits around $383. The shares could run into selling pressure at this level near a series of peaks and troughs that formed on the chart between mid-November and late January.
Story Continues


